24 September 2021·5 min read
What Would Have to Change?
My bachelor thesis: counterfactual explanations for ECG classification, and what two cardiologists made of them.
A neural network looks at an electrocardiogram and says "ST/T change, 95 percent". For a cardiologist that number is not an explanation. The question they actually ask is a different one: what would this recording have to look like for the model to call it normal?
That question is what a counterfactual explanation answers, and it is what my bachelor thesis at Freie Universität Berlin was about. Studies had shown that people find counterfactuals more informative and more convincing than most other explanation techniques, and almost nobody had tried them on time series as complex as a heartbeat. So I did.
The method
I worked with a method called Native Guide. The idea is refreshingly simple. Take the recording you want to explain, and find the most similar recording in the training data that the model puts in a different class. That neighbour is the "native guide". Then ask the model which stretch of the signal mattered most for its decision, and swap that stretch in from the guide, a little longer each time, until the prediction flips. What you end up with is a real looking ECG that sits just across the model's decision boundary, and the difference between it and the original is the explanation.
Three ingredients make it work: a convolutional classifier whose last layers expose feature maps, a class activation map that turns those into an importance value for every point in time, and dynamic time warping to find a neighbour that is similar in shape rather than only in timing.
I compared three classifiers for this, a fully convolutional network, a residual network and InceptionTime, on the PTB-XL dataset of twelve lead ECGs. They landed within a few points of each other, so I kept the simplest one and spent the time on the part that turned out to matter.
Where it broke, and what fixed it
Hearts do not beat in step. Two recordings can be similar in every way that counts and still have their peaks in different places, because one person's pulse was a little faster. When the method swapped a stretch between two such recordings, the result had extra peaks in between the real ones. The model was happy to call it normal. No doctor would have believed it for a second.
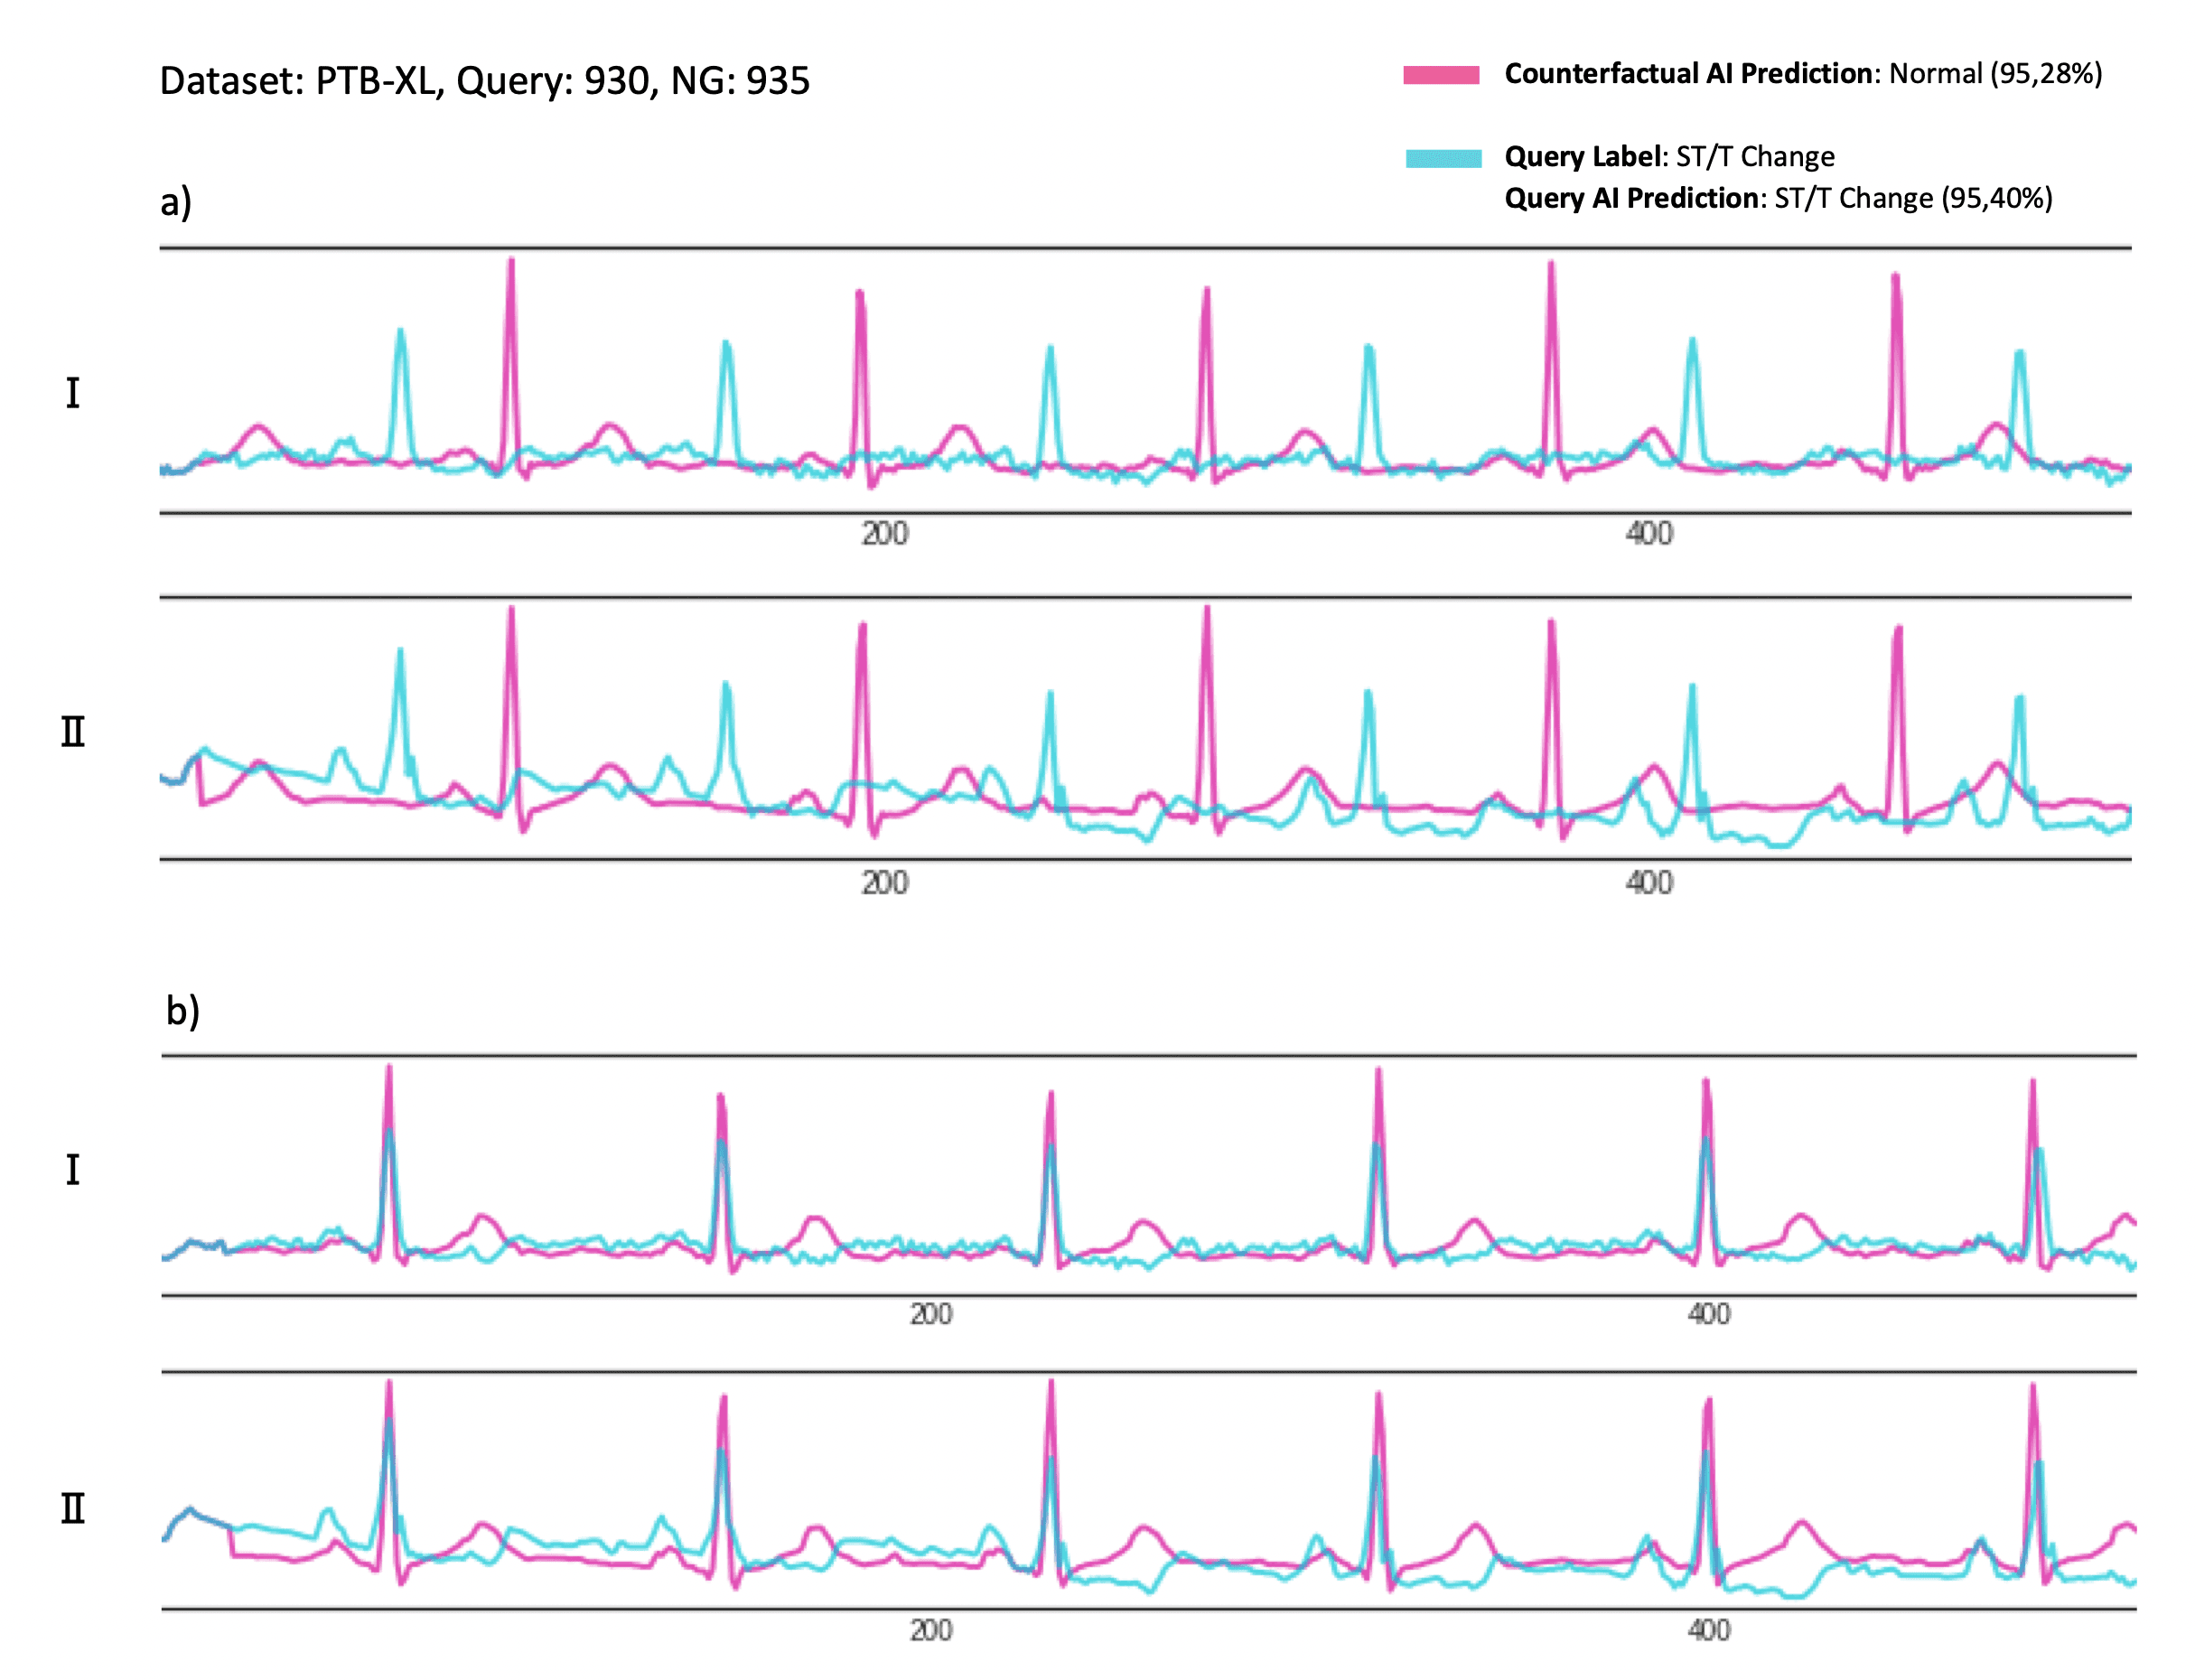
The fix became the main contribution of the thesis: before anything is swapped, both recordings are normalised in strength, the guide is stretched or squeezed so that the distance between its R peaks matches the original, and the two are shifted until their peaks coincide. That last step uses cross correlation through a Fourier transform, which sounds heavier than it is. Across more than two thousand test recordings, the synchronised guide kept its predicted label in 94 percent of cases, so the alignment rarely changed what the model saw.
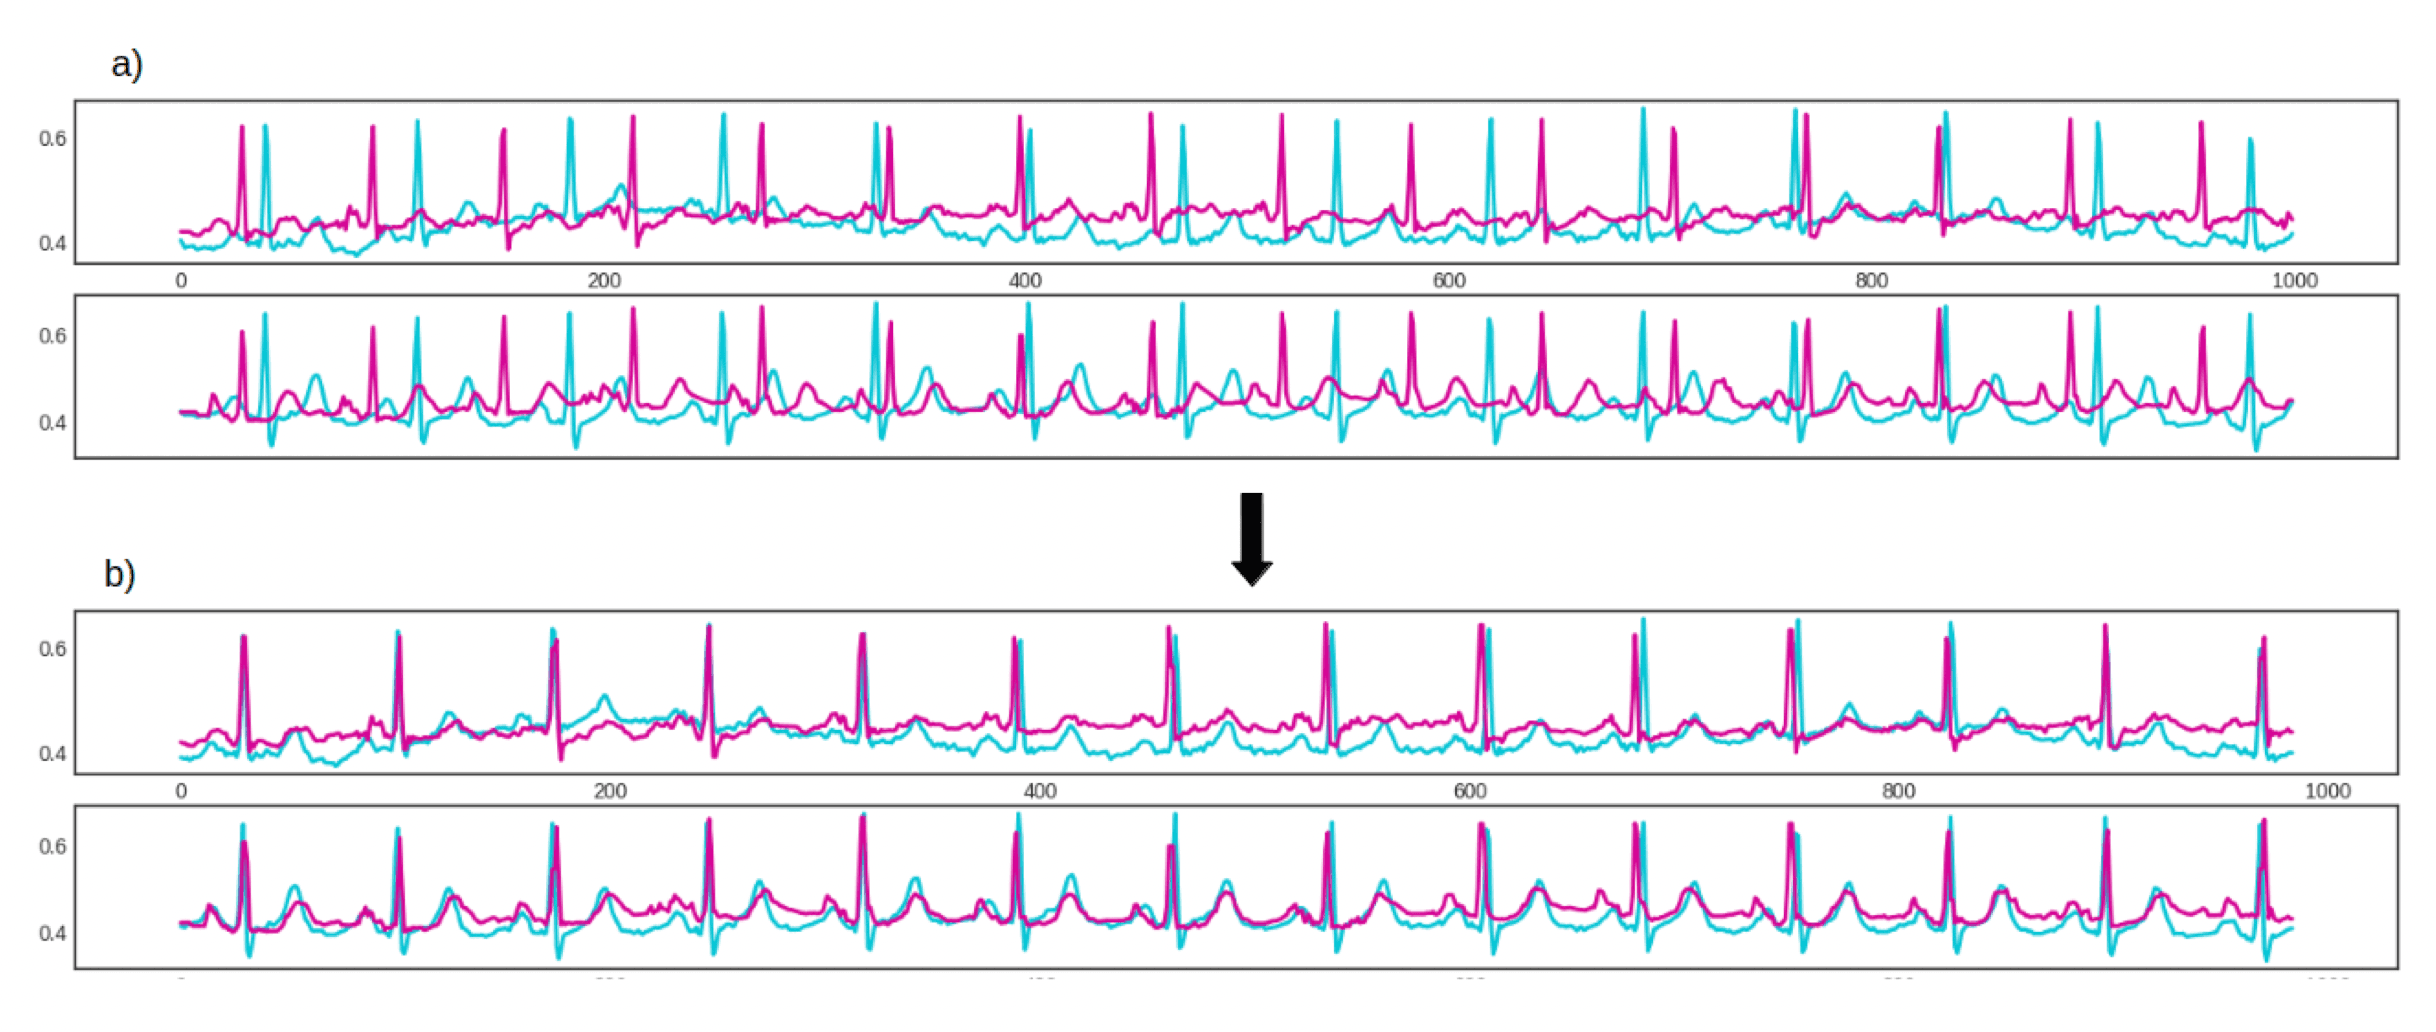
I tried two more ideas. Swapping single important points instead of one continuous stretch produced chaotic signals that jumped back and forth between the two recordings, and it changed more points, not fewer. That one went into the thesis as a clear negative result. Moving the decision threshold worked better: asking for a bit more than a coin flip before accepting a counterfactual made the results noticeably safer, at the cost of a longer swapped stretch. Around 40 percent felt like the right balance.
Two cardiologists
The part I remember most is the evaluation. I sat down with two experienced cardiologists, showed them recordings from the dataset, asked for their own diagnosis, then revealed the model's prediction and the counterfactual, and finally asked them to draw the counterfactual they would have expected. Neither of them had ever seen an explanation like this.
One of them was pleased with every counterfactual he saw and, without being asked, singled out the synchronised overlay as the thing that made them useful. Even in cases where perfect alignment is impossible, seeing the first peaks coincide helped him spot the delay that pointed to the condition. The other was more demanding. He wanted changes that are as small as possible and sit exactly at the threshold between healthy and not, and he was right that the swapped stretch was still long and crude.
Both saw where this could go: training junior doctors, who learn ECG reading by seeing the critical sections in all their variations, and supporting colleagues in emergency settings who are not ECG specialists but need to catch a heart attack quickly. And both flagged something I had not expected. Several recordings in the public dataset were, in their view, mislabelled. A model can only be as trustworthy as the labels it learned from.
What stayed with me
Writing this thesis taught me the thing I still build products around: an accurate model is not the same as a system a person can trust. The counterfactual only became an explanation once it respected how cardiologists actually look at an ECG, aligned, on the calibration they are used to, with the change in the place they would look. The hour with each expert was worth more than any metric I computed.